

Stop Using Pie Charts (Do THIS Instead)
From Leila Gharani · · 9 min
The player loads from YouTube only when you click. It uses YouTube's privacy-enhanced mode.
If the video does not play, the owner may have turned off embedding. Watch it on YouTube instead.
Description
🔥 Create charts that wow your audience. Learn the secrets now, start today! 👉 https://link.xelplus.com/yt-bizcharts-course
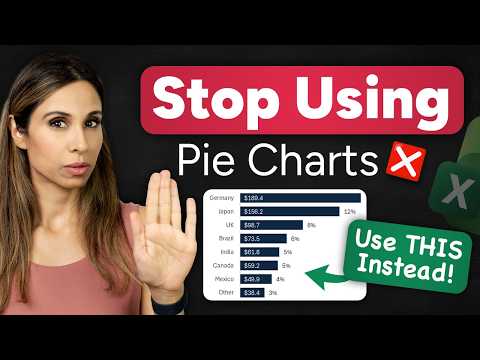
Still using a pie chart for lots of categories? Even if your boss asks for a pie chart, there’s a better option in Excel.
⬇️ DOWNLOAD the workbook here: https://pages.xelplus.com/better-pie-charts
In this video, you’ll learn how to build a clean, professional bar chart that’s better than a pie chart, while keeping all the same info people love about pies (including percent of total). You’ll also make it auto-update and auto-sort with a simple formula setup, so your chart stays readable even when the data changes.
Timestamps: 00:00 Stop sending messy pie charts 00:59 Build the better chart: linked data + bar chart 03:15 How to show % on the bar chart 04:48 Auto-sort the chart with SORT 06:47 Add a dynamic total to the chart title 08:34 Final comparison: pie chart vs readable chart
What you’ll learn: - Why pie charts fall apart with too many slices - A faster, cleaner chart you can actually present - How to add currency labels and percent labels to a bar chart - The “duplicate series” trick to show percentages without clutter - How to keep your source data intact, but make the chart sorted automatically using SORT() - How to add a dynamic total to the chart title (updates as data changes)
If you want to create charts that look like they belong in real reports (and not in a spreadsheet from 2006), this one’s for you.
📨 Subscribe to "Between the Sheets" newsletter to stay on top of office tips and Excel hacks: https://link.xelplus.com/yt-d-newsletter
🔓 Join this channel to get access to perks: https://www.youtube.com/channel/UCJtUOos_MwJa_Ewii-R3cJA/join
🎬 LINKS to related videos: Fast & Easy! McKinsey Chart in Excel: https://youtu.be/-Pi68IkutaQ The Excel Timeline chart you'll actually keep using: https://youtu.be/GP1W4fKWUrA
👕 Get the Official XelPlus MERCH: https://xelplus.creator-spring.com/
🧭 Not sure which of my Excel courses fits best for you? Take the quiz: https://www.xelplus.com/course-quiz/
🧰 Resources I recommend: https://www.xelplus.com/resources/
🛒 More resources on my Amazon page: https://www.amazon.com/shop/leilagharani
📲 Let’s connect on social: Instagram: https://www.instagram.com/lgharani LinkedIn: https://www.linkedin.com/company/xelplus
This description contains affiliate links, which means at no additional cost to you, we will receive a small commission if you make a purchase using the links. This helps support the channel and allows us to continue to make videos like this. Thank you for your support!
#Excel